TL;DR
AI inference infrastructure fails differently than traditional web infrastructure: GPUs report healthy while producing degraded outputs. The five production failure modes nobody warns you about are silent model quality degradation, KV cache thrashing, batch queue deadlock, provider hardware degradation, and cascading timeout propagation. The fix is performance-based health checks, business-metric alerting, end-to-end synthetic monitoring, and multi-provider redundancy.
The Core Problem: AI Infrastructure Lies About Being Healthy
Traditional web infrastructure fails predictably. A database goes down. A service exhausts memory. A network partition isolates a region. Decades of tooling and runbooks address each.
AI inference infrastructure fails differently. Your GPU can be technically alive — drivers running, CUDA healthy, container responding — and still produce degraded outputs because model weights loaded incorrectly, GPU memory fragmentation pushed your KV cache into a pathological state, or your batching queue backed up so severely that P99 latency is 45 seconds while your health check still returns 200 OK.
This is the central problem that separates a well-architected AI model deployment platform from a general-purpose cloud with a model on it: your infrastructure thinks it's healthy when it isn't.
Five Production Failure Modes Nobody Warns You About
1. Silent model quality degradation
Outputs degrade without any system-level error. Temperature drift, silent context window truncation, quantization regressions on specific input distributions — your monitoring sees zero errors while users see incoherent outputs. Evidently AI's research covers this failure class extensively.
2. KV cache thrashing
When the KV cache fills and starts evicting sequences, latency spikes dramatically while error rate stays at zero. Your error-rate alert doesn't fire. P50 doesn't fire. Only P99 tells the story — and only if you're explicitly tracking it.
3. Batch queue deadlock
Under specific traffic patterns, continuous batching schedulers can enter states where they wait for a batch to complete before accepting new requests, while that batch waits for resources tied up by the incoming queue. Sudden latency cliff, no corresponding GPU utilization increase — confusing every standard debugging heuristic.
4. Provider hardware degradation
GPU cloud providers occasionally shift workloads to underperforming hardware without notification — oversubscribed nodes, degraded NVLink, thermal throttling. Your token generation speed has dropped 40% and your only signal is a user complaint. This is one of the strongest arguments for multi-provider AI inference infrastructure.
5. Cascading timeout propagation
When your vector database for RAG retrieval slows down, timeouts propagate upstream. By the time your alert fires, three independent systems show red, and the actual root cause was a slow database query twelve minutes ago.
Building AI Infrastructure That Tells the Truth
The solution is not more alerts. It's better signals with tighter coupling to what matters.
Replace binary health checks with performance health checks. Stop asking "is the service up?" Start asking "is the service performing within bounds?" Your health endpoint should return current P95 latency, tokens/second, batching queue depth, and GPU memory utilization — not just HTTP 200.
Alert on your business metric, not your system metric. Successful token completions per minute, or requests served within SLA as a percentage of total. GPU utilization is a diagnostic instrument, not a primary alert.
Implement end-to-end synthetic monitoring. Every 60 seconds, send a known test prompt and measure round-trip latency and output format compliance. You'll know about failures before your first real user does.
Log full inference context on every request. Model version, GPU node, queue depth at request time, quantization applied. Logging only on errors means you'll never have the debugging context you need.
The Multi-Provider Reliability Architecture
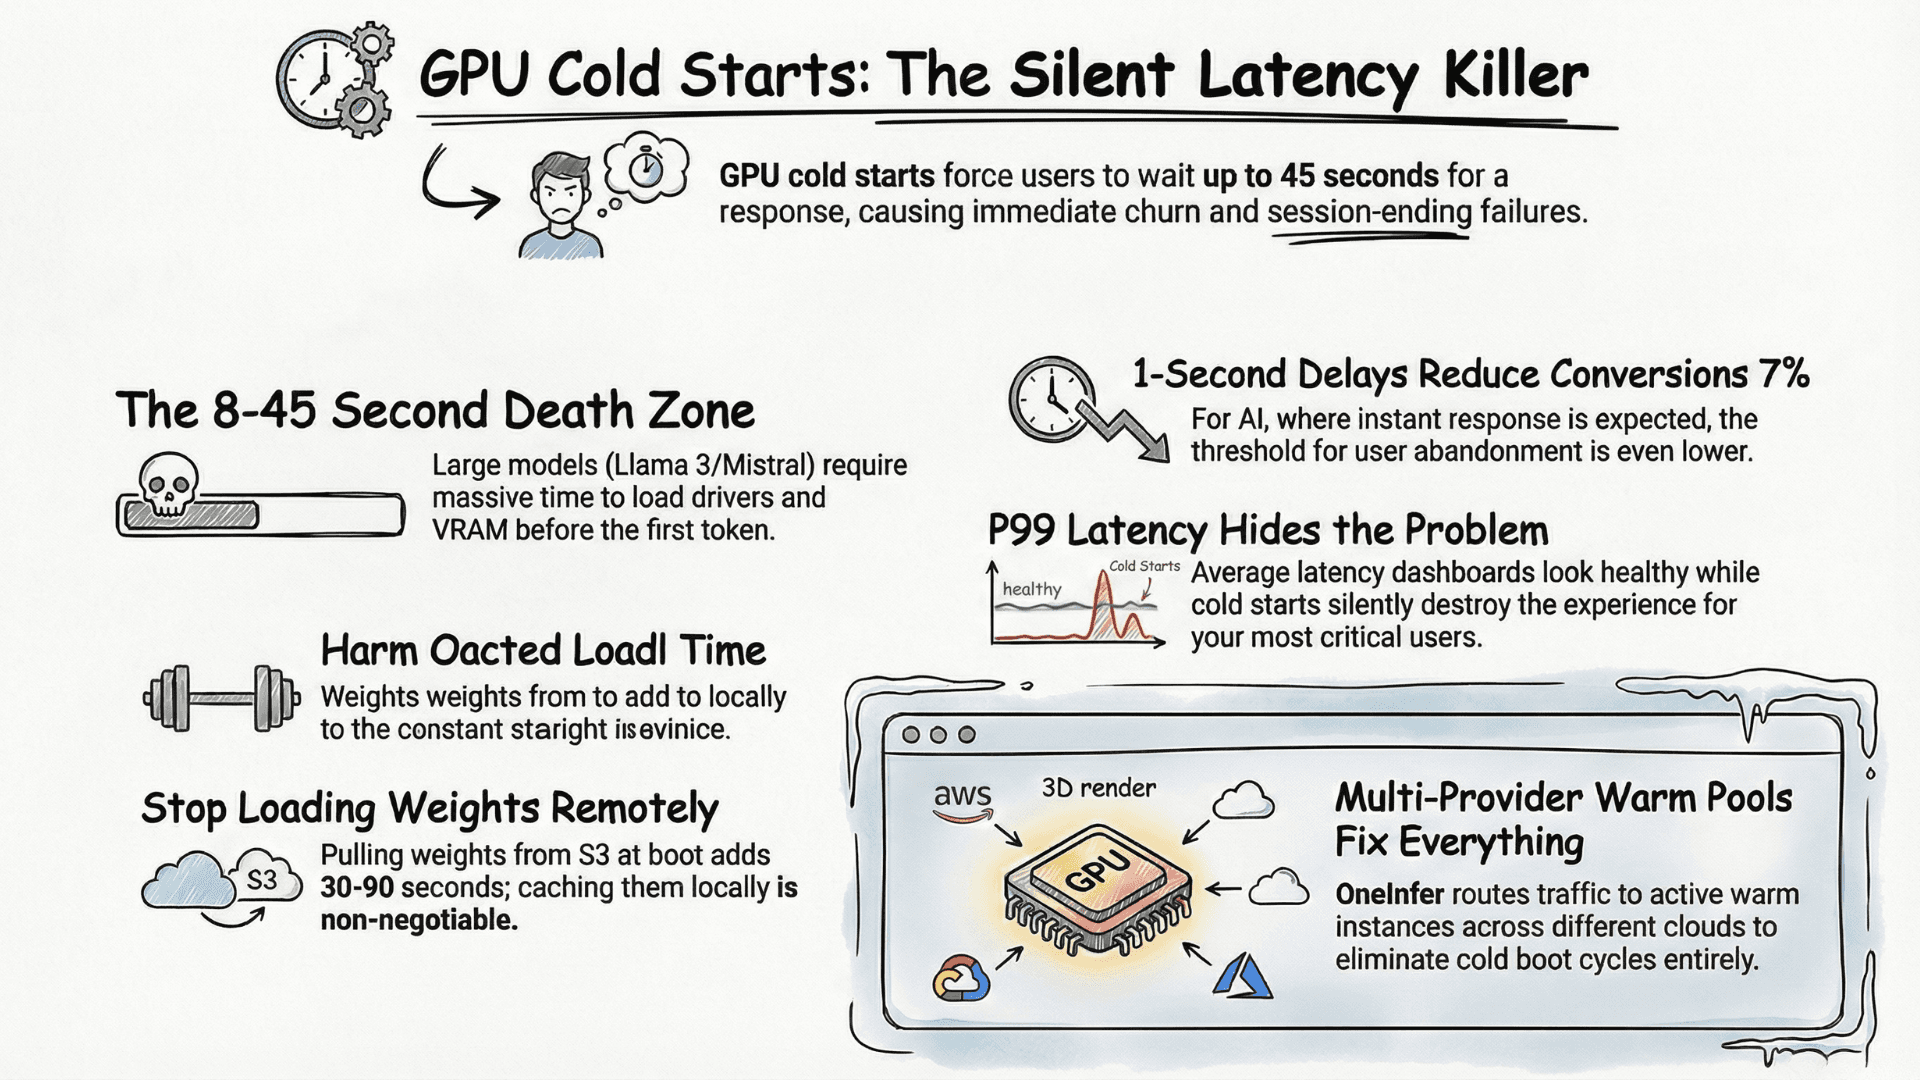
One of the highest-leverage reliability improvements is eliminating single-provider dependency. OneInfer's multi-provider infrastructure distributes inference across multiple GPU clouds simultaneously. Our routing layer monitors provider performance health continuously — token generation speed, queue depth, P95 latency trends — and automatically shifts traffic away from degrading providers before errors surface.
The unified observability dashboard puts all the signals that matter — per-provider performance, cost trends, queue depth — in one place. When something starts degrading at 3AM, you see it in one view, and the routing layer has already started working around it.
The On-Call Runbook You Actually Need
- 1Start with your end-to-end synthetic test. Failing means real and on critical path. Passing means isolated to a traffic pattern or segment.
- 2Check token generation speed. Drop with stable error rate → hardware or KV cache. Stable speed with rising errors → software or config.
- 3Check queue depth. Rising queue + stable GPU util → upstream/downstream bottleneck. Rising queue + high GPU util → compute ceiling hit.
- 4Check per-provider metrics. Concentration on one provider? Degraded performance vs baseline?
3AM incidents are unavoidable. AI infrastructure that lies about its health turns them into existential events. Infrastructure built to tell the truth — and route around its own failures — makes them survivable. Visit oneinfer.ai or talk to the team.
Run multimodal AI inference at production scale
OneInfer routes every request to the optimal GPU across multiple cloud providers in real time, with sub-500ms latency, AI-generated kernel optimization, and transparent pricing.
Frequently asked questions
+Why does AI infrastructure fail differently from traditional web infrastructure?
AI infrastructure can be technically alive — drivers running, container responding, health check green — while producing degraded outputs because of KV cache fragmentation, silent model quality drift, or batching queue deadlock. Traditional health checks miss all of it.
+What is KV cache thrashing in LLM inference?
KV cache thrashing happens when the cache fills and starts evicting active sequences to make room. Latency spikes dramatically while error rate stays at zero, so error-rate alerts never fire — only P99 latency reveals it.
+How should AI inference health checks be implemented?
Replace binary 'is it up' checks with performance health checks that return P95 latency, token generation speed, batching queue depth, and GPU memory utilization. Alert on business metrics like successful completions per minute, not on raw GPU utilization.
+What is end-to-end synthetic monitoring for AI inference?
Every 60 seconds, send a known test prompt to your production endpoint and measure full round-trip latency and output format compliance. Failures show up in the synthetic before your first real user complains.
+How does multi-provider routing improve AI infrastructure reliability?
Multi-provider routing distributes inference across multiple GPU clouds, monitors per-provider performance continuously, and automatically shifts traffic away from degrading providers before user-facing errors occur — using comparison baselines as a degradation signal.